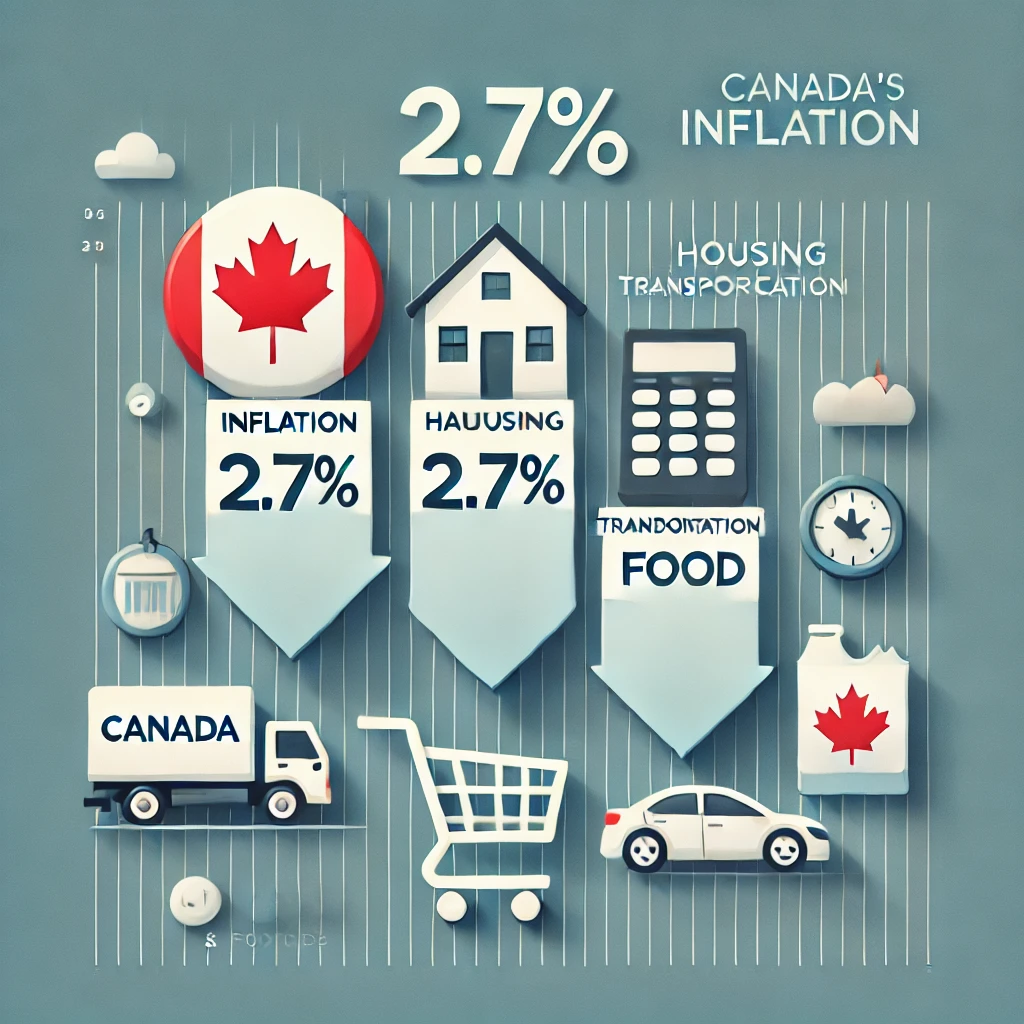
Current Canada Inflation Rate: 2.7%
Updated on May 21, 2024: April inflation declined to 2.7% compared to 2.9% in March. Excluding gasoline inflation was 2.5% in April compared with 2.8% in March and 2.9% in February. On a monthly basis, inflation was 0.5% compared to 0.6% in March and 0.3% in February. Close to two-thirds of the annual inflation is due to the rise in the shelter component while transportation contributed around 1/5 to headline inflation. Food inflation reached its lowest level since July 2021. April inflation data shows significant progress in taming inflation. This decline in inflation over the coming months should allow the Bank of Canada to lower its policy rate.
Measures of Core Inflation
It is understood that inflation is often a monetary problem. It is also understood that high inflation harms the fabric of society. Thus, most modern economies have independent central banks tasked with controlling inflation. Central banks need to see the underlying trend of inflation. Since food and energy prices have historically been the most volatile components of the CPI basket, core inflation is defined as changes in the consumer price index for all items, excluding food and energy. In Canada, CPIX excluded fruits, vegetables, gasoline, fuel oil, natural gas, mortgage interest, intercity transportation and tobacco products. CPIX also excludes price changes because of indirect taxes.
Bank of Canada (BoC) used CPIX as its measure of the underlying trend of inflation. However, BoC research found that CPIX is not suitable for guiding monetary policy since other components can show volatility as well, while prices of excluded components also change due to underlying inflationary pressures. That study suggested that no single measure of core inflation is suitable for guiding monetary policy. Yet there are three reasonably good measures of core inflation: CPI-trim, CPI-median and CPI-common.
The percentage change in the price of each CPI component constitutes a distribution. Excluding the components in this distribution’s left and right tail would produce a basket whose price change is CPI-trim. CPI-trim produced by Statistics Canada and used by the BoC excludes 20% of CPI components with the greatest price rises and 20% of CPI basket components with the greatest price declines or least price increases. Thus, CPI-trim inflation reflects changes to the price of 60% of CPI basket components. CPI-median inflation measures the rise in the price of the CPI component whose price is rising faster than half of CPI basket components but slower than the price of the other half of CPI basket components. Finally, CPI-common measures the price changes in common between different CPI components and excludes price movements in specific CPI components. The calculation of the CPI-common is quite mathematically involved.
A Guide to Inflation in Canada
Inflation is a measure of how fast prices are rising. It’s important to pay attention to inflation, because it can have a big impact on your standard of living.
Inflation affects you in two ways. First, it reduces the purchasing power of your money. This means that if prices are rising, your dollar will buy less and less over time. Second, inflation in Canada can lead to higher interest rates in Canada, which can impact your ability to borrow money or make investments.
In general, a low and stable inflation rate is good for the economy. It encourages spending and investment, which leads to economic growth. But too much inflation can be a bad thing. It can lead to uncertainty and higher interest rates, which can hurt borrowers and slow down the economy.
This page will take a look at inflation in Canada, how it’s measured, and what it means for you.
What Is Inflation and How Is It Measured?
Inflation is the rate at which prices for goods and services rise. With inflation, you won’t be able to buy the same amount of goods and services in the future as you did in the past with the same amount of money. This means that inflation reduces your purchasing power over time.
Inflation is usually measured as a 12-month percentage change in the Consumer Price Index (CPI). The CPI is a basket of common goods and services that Canadians purchase. It’s created by Statistics Canada based on their Survey of Household Spending (SHS), and it includes goods and services such as food, shelter, clothing, transportation, and recreation.
The CPI is used to measure inflation because it shows how much Canadians are paying for a typical basket of goods and services. If the CPI increases, this means that prices that Canadians are paying are increasing. Data is collected across the country, however, this is proportional to the population of each region. For example, 40% of the CPI basket is from Ontario, while close to 40% of Canada’s population can be found in Ontario. This allows CPI to be representative of the average Canadian.
The change in the CPI over a 12-month period is the annual inflation rate. This is based on a rolling 12-month period, which means the 12-month period ending in the month that is being reported on. For example, the September 2022 inflation rate would be based on the change in the CPI from September 2021 to September 2022.
Can Past CPI Data Be Revised?
A CPI revision is a change that is made to the Canadian Consumer Price Index (CPI) after it has been released. Revisions can be made for a number of reasons, such as errors in the data, changes in methodology, or updates to the CPI basket.
Statistics Canada does not revise past CPI data, unless there has been an error in the Canadian CPI. This follows the International Labour Organization (ILO) Resolution II – Resolution concerning consumer price indices, which says that retrospective revisions to the CPI should be avoided.
However, while past data can’t be revised, the calculation of future inflation data can. That’s because Canada’s CPI basket weightings are revised every year. This is to ensure that the CPI still tracks the consumption habits of Canadians accurately.
The Consumer Price Index
The Consumer Price Index (CPI) is a measure of the average change over time in the prices paid by Canadian consumers for a basket of goods and services. The CPI measures price changes from month-to-month and year-to-year. It is designed to represent the spending patterns of a typical Canadian household, and it is used by governments, businesses, and individuals to make economic decisions.
Statistics Canada releases CPI data by province and territory, and even by city.
The CPI is an index, which means that it is made up of various components, each of which has a specific weight. This weighting is updated annually based on the previous year’s household expenditures, found through the Household Final Consumption Expenditure report. The more Canadians spend on a specific category, the more price changes in that category will affect Canadians. That’s why the CPI is weighted based on actual spending on specific categories.
Over the past two decades, services have also been a greater source of inflation than goods in Canada. From 2002 to 2022, the 20-year change in the price index for goods was 42.5%. In comparison, the 20-year change in the price index for services was 62.7%. This means that the average annual inflation rate for goods over the past 20 years has been 1.79%, while the average annual inflation rate for services has been 2.46%.
From 2002 to 2022:
Annual Inflation Rate for Goods: 1.79%
Annual Inflation Rate for Services: 2.46%
Recently, the COVID-19 pandemic has changed the make-up of Canada’s economy. Services are making up less of Canadians’ spending, which is reflected in a lower basket weighting. This shift in spending is likely due to a combination of factors, including changes in consumer behavior as a result of the pandemic, as well as temporary disruptions to the supply of certain goods and services. For example, travel services have been severely impacted by the pandemic, while there has been an increase in spending on groceries and other household items.
In a reversal of the past two decades, the inflation rate of goods over the second half of 2021 and the first half of 2022 became almost double that of services. For June 2022, the annual inflation rate for goods was 11.2%, while the same 12-month period saw an annual inflation rate for services at just 5.2%.
From June 2021 to June 2022:
Inflation Rate for Goods: 11.2%
Inflation Rate for Services: 5.2%
Regional CPI Basket Weights
Prices used in Canada’s Consumer Price Index are collected across the country. Regional differences in prices can occur, but in aggregate, they provide a national picture of inflation. In order to ensure that the CPI is representative of prices paid by Canadians, the weight of prices of each province and territory is based roughly on population. For example, Ontario accounts for 40.46% of the CPI basket, while Ontario accounts for 38.8% of Canada’s population.
How to Calculate Inflation Rate
To calculate the inflation rate, you need to know two things:
- The price of a goodor service in the current year
- The price of the same good or service in the previous year
In general, the inflation rate for any good or service is calculated using the following inflation rate formula:
Inflation Rate = ((Current Year Price - Previous Year Price) / Previous Year Price) × 100
When calculating Canada’s inflation rate, you would use the CPI value in the current year with the CPI value in the previous year. As the inflation rate is usually stated as an annual rate, but based on monthly CPI data releases, you would use the same month between years. For example, the September 2022 inflation rate would be based on the September 2021 CPI value and the September 2022 CPI value.
Let’s calculate the inflation rate for June 2022. To do so, you would need to know the CPI values for June 2022 and June 2021. They can be found by using Statistics Canada’s Consumer Price Index Portal. You can also find updated CPI data on this page.
June 2021 CPI: 141.4
June 2022 CPI: 152.9
Using the inflation rate formula, plugging in the values would give you an inflation rate of 8.1%.
June 2022 Inflation Rate = ((152.9 - 141.4) / 141.4) × 100 = 8.1%
There are other ways to calculate inflation too. You might want to find the inflation rate for a specific good or service over a certain period of time. This might not be over a one-year time period. Instead, it might be over multiple years, or even just one month. The section below will take a look at other ways to calculate inflation.
What is Deflation?
When prices go down, it’s called deflation. Deflation is bad for an economy, as it can lead to a downward spiral. For example, if prices keep on falling, people might want to wait to make purchases later rather than buying now. This can lead to less spending in the near term, which hurts businesses and can lead to layoffs.
A low level of inflation is a sign of a healthy economy. Central banks usually have an inflation rate target. The Bank of Canada has an inflation-control target of 2%, in between their target range of 1% to 3%. If inflation goes outside of this target, the Bank of Canada will conduct monetary policy, such as increasing or decreasing its policy interest rate, so that inflation returns within this target range within 2 years.
Calculating Inflation Rate with Prices
Gas prices have been a major inflation topic over recent years. According to Statistics Canada, the average price for a liter of gasoline in Canada in June 2021 was $1.33. In June 2022, the average price is now $2.07 per liter. What would be Canada’s gasoline inflation rate?
To calculate the inflation rate, you would subtract the 2022 price from the 2021 price ($2.07 – $1.33 = $0.74) and then divide by the 2021 price ($0.74/$1.33 = 0.5564). The answer would be expressed as a percentage, so you would multiply by 100 to get 55.6%. This means that the price of gasoline increased by 55.6% from June 2021 to June 2022!
Month-to-month inflation can also be calculated. For example, the average retail price for a kilogram of apples in Canada was $5.58 in May 2022 and $5.69 in June 2022. Using the same inflation rate formula:
- $5.69 – $5.58 = $0.11 increase
- ($0.11 / $5.58) x 100 = 1.97%
The monthly inflation rate for apples in Canada was 1.97% in June 2022. In comparison, the price of a dozen eggs fell from $4.24 in May 2022 to $4.19 in June 2022. Prices don’t always go up from month-to-month, which means that negative price changes are more likely to be seen when looking at the monthly inflation rate for certain items. This usually includes food and energy prices.
What is Core CPI?
Food and energy prices are volatile, with prices also being influenced by seasonality, and this can affect the overall CPI. That’s why the core CPI is often used to look at the long-run trend that inflation is heading. The core CPI excludes food and energy prices, to measure core inflation.
Calculating Inflation Rate Using a Base Year
In Canada, the CPI is referenced with 2002 as the base year. This means that the CPI value for 2002 is equal to 100. When calculating inflation, you might want to select your own base year. Let’s take a look to see how that is done.
Let’s say that you want to use January 2020 as the base year to calculate the inflation rate of oranges between January 2021 and January 2022. The average retail prices for a kilogram of oranges in Canada is as follows:
January 2020: $3.52
January 2021: $3.69
January 2022: $4.17
Next, you will need to set January 2020 as the base year, and then adjust the other values to account for this index. This is done by dividing the other values by the base year price.
January 2020: ($3.52/$3.52) x 100 = 100
January 2021: ($3.69/$3.52) x 100 = 104.83
January 2022: ($4.17/$3.52) x 100 = 118.47
Now that we have the price index values, calculating the inflation rate is the same steps as above. For the January 2022 inflation rate, compared to January 2021’s prices:
- 118.47 – 104.83 = 13.64 increase
- (13.64 / 104.83) x 100 = 13.01%
The annual inflation rate of oranges in January 2022 was 13.01%.
Why Use a Reference Base Period?
A reference base period is used to easily compare CPI of different categories over a certain period of time. It’s easier to compare than looking at average prices on its own. From the example above, we can easily see that the price of oranges in January 2022 is 18.47% higher than the prices in the January 2020 base period. This can then be quickly compared with other categories with the same base period.
How Does Inflation Impact You?
What does inflation mean for you and your money? When it comes to your personal finances, inflation can have both positive and negative impacts. Traditionally, the winners of inflation are borrowers and debtors, while the lowers are savers. That’s because if you have money saved up, inflation will decrease the purchasing power of that money over time. When prices go up due to inflation, your money will be worth less and less. On the other hand, if you have a lot of debt, inflation can actually help you out because it will decrease the real value of your debt to a certain extent.

